
StrataWorks® Design-to-Build Accuracy
Table of Contents
1. Overview
Filters operating from X-band and above are frequently a long-lead, high-cost element of a millimeter-wave signal chain. A custom passband has traditionally meant high non-recurring engineering (NRE) and several design iterations before first hardware, a barrier that pushes most programs toward compromising with catalog parts. StrataWorks removes that barrier: engineers specify and simulate a semi-custom filter directly in the browser, with NRE and a build together coming in under $10,000.
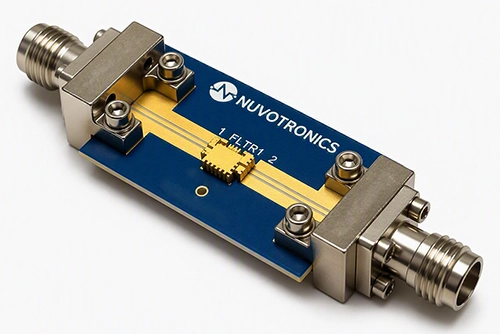
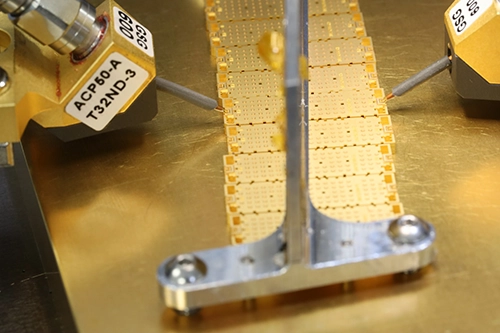
This app note focuses on highlighting the fidelity of the initial StrataWorks simulation to final delivered product. To prove this, a 7th-order interdigital filter centered at 18.6 GHz with 12.6% fractional bandwidth was designed in StrataWorks, fabricated in the PolyStrata process, and characterized two ways – by probing the singulated part off-wafer and on a connectorized RO4350B evaluation board. The probed measurement provides the cleanest comparison to simulation, while the evaluation board adds roughly one inch of input and output routing plus 2.4 mm connectors and is included as a real-world reference. Across passband insertion loss, return loss, and broadband rejection, the measured performance confirms that the StrataWorks simulation is an accurate predictor of delivered hardware.
2. Measurement Approach
Validating the tool requires comparing the simulation a customer actually receives against the hardware that ships. Four datasets are used throughout this note, spanning the design flow from the instant a filter is synthesized to its measured performance in a system fixture. They are summarized in Table 1 and shown together in every figure that follows.
| Dataset | Stage in Flow | Description |
|---|---|---|
| StrataWorks Simulation | Pre-order (instant) | Initial synthesized response downloaded directly from the StrataWorks tool. Available immediately, with no order and no NRE. |
| Post-Layout Simulation | Post-order verification | Full-wave simulation of the as-drawn mask artwork, run after an order to confirm the synthesized design survived layout intact. |
| Probed | Fabricated part | Direct measurement of the singulated part. Provides the highest isolation and the cleanest correlation to simulation. |
| Evaluation Board | Fabricated part + fixture | Part mounted on a connectorized RO4350B board (~1 in routing per port plus 2.4 mm connectors); representative of in-system performance. |
Table 1: Datasets compared throughout this note
The Probed dataset is measured on a part that has been singulated from the wafer. Probing the singulated part rather than probing on-wafer trades a small amount of convenience for better isolation: an on-wafer measurement couples to surrounding metallization and adjacent structures, which slightly degrades the apparent out-of-band response. The difference is minor, but the off-wafer measurement is the more faithful representation of the standalone filter.
3. Results
The fabricated filter was measured against both simulation references across transmission and reflection. Each figure overlays all four datasets defined in Table 1.
3.1 Broadband Response
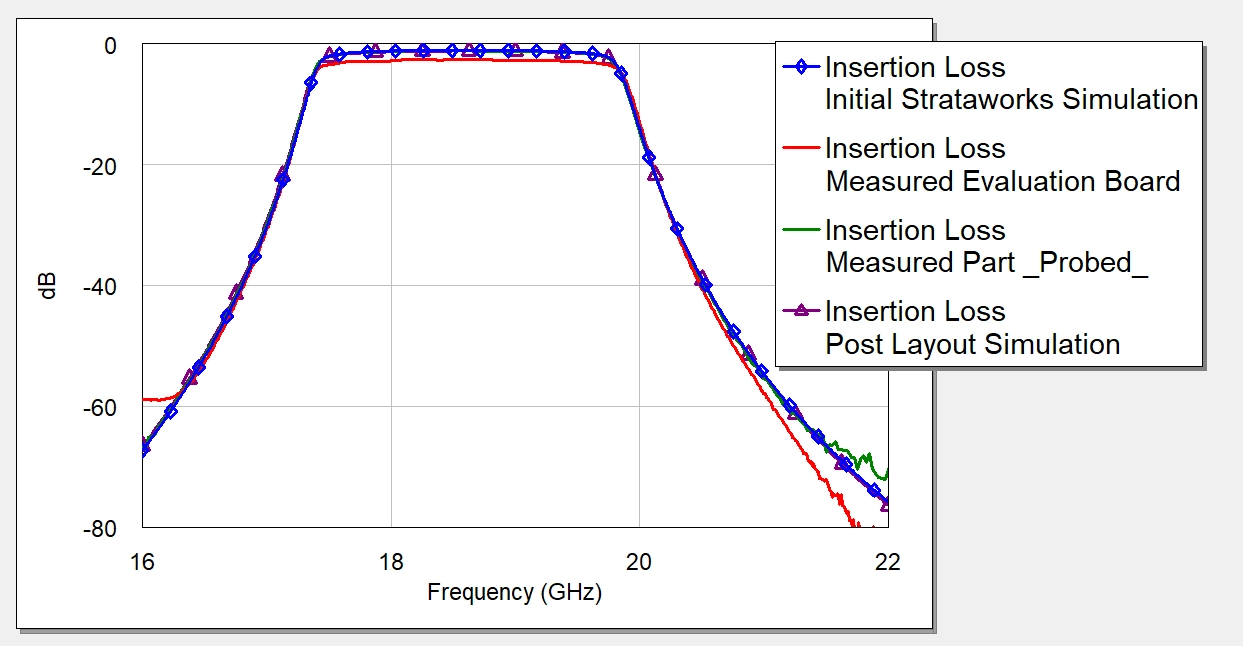
Figure 2 shows the broadband transmission response. Across more than 60 dB of dynamic range, the two simulations, the probed part, and the evaluation board are nearly indistinguishable – passband edges, skirt selectivity, and the rejection floor all overlay. Agreement at this scale is the headline result: the filter a customer synthesizes in StrataWorks reproduces in hardware with no tuning. The only visible divergence is at the band edges, where the probed and post-layout traces meet the measurement dynamic-range floor.
3.2 Passband Insertion Loss
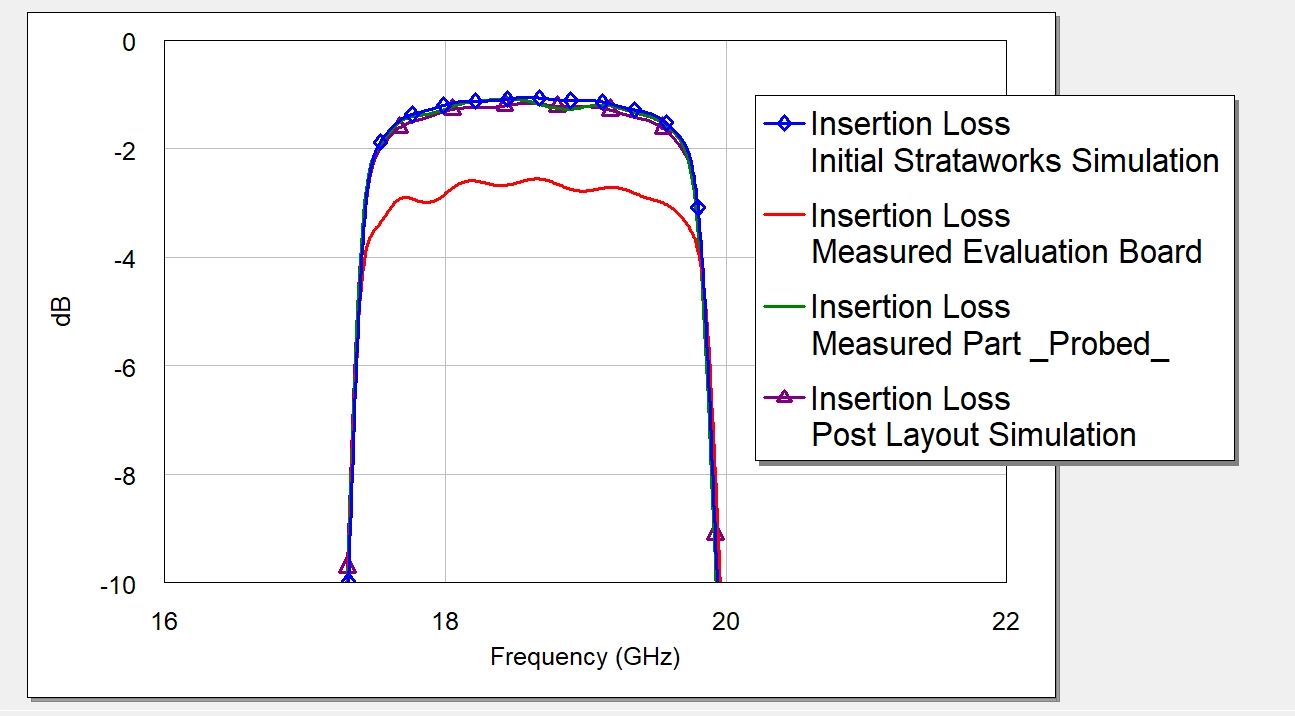
Figure 3 zooms into the passband. The probed measurement falls within a few tenths of a decibel of both simulations, with mid-band insertion loss near 1 dB – direct confirmation that the loss predicted in the tool is the loss of the delivered filter. The evaluation board sits roughly 1.5 dB lower across the band. This offset is the test fixture, not the filter: approximately one inch of RO4350B microstrip per port plus two 2.4 mm connectors. It appears as a flat insertion-loss pedestal and de-embeds cleanly, which is why the evaluation board is presented only as an in-system reference.
3.3 Return Loss
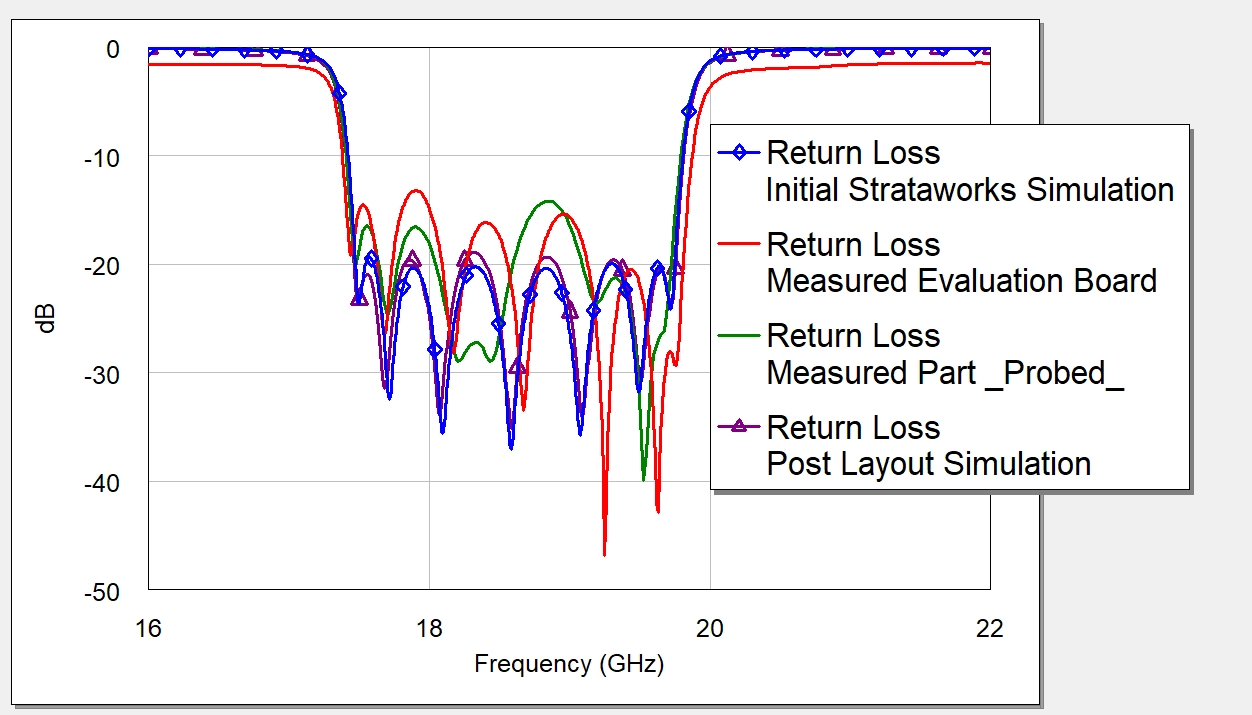
Figure 4 shows input return loss. The simulated and probed responses share the same in-band match, with reflection zeros at the same frequencies and passband return loss on the order of 15 dB. The evaluation board carries additional ripple and a raised out-of-band reflection floor from the connector transitions, but preserves the in-band match – again consistent with a well-behaved fixture rather than a filter-level discrepancy.
4. Summary
Across passband loss, return loss, and broadband rejection, the fabricated filter matches the StrataWorks simulation. The simulation a customer downloads at no cost is a quantitative predictor of delivered hardware; the post-layout simulation adds a verification checkpoint after order; and the off-wafer probed measurement closes the loop on the physical part. The evaluation board confirms the same response under realistic in-system fixturing, with the expected and well-understood penalty of routing and connector loss.